


")
")


The above references an opinion and is for information purposes only. It is not intended to be investment advice. Seek a duly licensed professional for investment advice.
The following article is an update on the recent run-up over 16’700$ (17th November) and the investor sentiment in which Bitcoin currently is.
The article will elaborate on Plan B’s Stock-to-Flow model (S2F) for Bitcoin; especially as the model proved itself to be once again correct.

Based in Zürich, Simon is an independent freelancer with a keen interest in digital assets and alternative investment. His background includes buy-side research position in investment companies and experience in Big Four accounting firms. Simon currently works as a junior portfolio manager in a wealth management company.
Graduated from the IFZ in Zug (Switzerland) with a MSc. in Banking & Finance, Simon started allocating digital assets as well as Bitcoin option strategies in his portfolio. Along with his personal researches, he developed a sound expertise in Distributed Ledger Technologies from an investment perspective and keeps on exploring the depths of this evolving technology.
Bitcoin all the way up
Nearly undiscovered by the public, Bitcoin (BTC) pitched up from 9’200$ to 16’700$ (17th November; YTD +81%). The Nakamoto coin is now only a 20% surge away from its all-time high (ATH) back in December 2017 (at roughly 19’900$).
We should note that Bitcoin could already push through the resistance at 13’000$ (end of June 2019).
Figure 1: Chart of Bitcoin (Tradingview)
Technical Analysis defines resistance as crucial “barriers” for rallies.
It is observed that around the price levels of any resistance investors tend to sell more. Hence, pushing through the resistance indicates a strong bullish signal for any underlying asset.
The reason for more selling pressure around those price levels is due to the fact that investors, who bought the last top (e.g. 13’000$ around June 2019) are now finally getting break-even with their initial investment.
They can eventually sell it now with a 0% profit.
If they sell…
In regards to Bitcoin, it is now aiming at the next resistance: the ATH at 19’900$ (end of 2017). If this resistance falls, Bitcoin has undoubtedly shaken up the last sellers and might continue to grow as the biggest black hole in modern finance.
How high are the chances to reach it though?
The answer can be found by elaborating on Plan B’s S2F model coming shortly.

S2F model works like a Swiss Clockwork
Another reason can explain why BTC has just started its journey towards the new ATH.
One of the most interesting models for Bitcoin developed by Plan B and published on March 22nd 2019 provides further insights.
The same way Nakamoto wants to remain anonymous, ‘Plan B’ identity follows the same pattern: unknown.
What we know from TV shows is that he/she could be an institutional investor based in Amsterdam. his/her approach is very quantitative and statistical. The S2F model itself is not highly demanding in terms of statistics. With a basic knowledge in regression analysis, one can surely understand why the S2F model is valid.
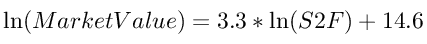
A regression analysis is performed in order to identify the potential correlation between a dependent variable (Bitcoin market value) and an independent variable (scarcity). For the independent variable Plan B defines the Stock-to-flow ratio as a proxy for scarcity.
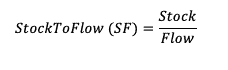
The S2F ratio is originally used in the commodity market and is a function of the flow and the total potential stock of a given commodity.
“S2F model works like a Swiss Clockwork“
Flow is the supply – mostly expressed in USD terms – which can be yearly produced and added to the stock. The stock is the size in USD of a given commodity hypothetically being available on the market if all sources are exhausted and mined.
Hence, the ratio can be expressed in a number of years needed in order to replace the total potential stock of a given commodity with the current production.

Generally, light commodities such as cotton, wheat, grain, soybeans, and other agricultural products have a low ratio -below 1. Indeed, light commodities supply is not capped such as the rare raw materials one (e.g. gold, silver, etc…).
Secondly, the supply has become very elastic due to productivity gains (mostly explained by the technology impact.
Nowadays, supply production can be increased in a very short amount of time. This in turns leads to the dilemma that higher prices due to a shortage of a specific commodity are quickly countered with ramped up production.
By observing Figure 2 one can barely identify a pattern between the “SF” and “Market Value” columns. A higher S2F ratio leads to higher market value. How will it look for an asset with a fixed cap and an ever-decreasing inflation rate?
Plan B tested this hypothesis by running a regression analysis.
And the results are exceptional flawless:
Plan B has not provided his original statistical output though.
Nevertheless, several BTC statistic fans have recalculated the model and validated it. There seems to be a power-law relationship. However, the most interesting statistical output numbers are R2 (measuring “goodness of fit”) and the p-value (significance). Both determine the overall statistical significance of the correlation between S2F and the market value of Bitcoin.
R2 being at approx. 0.95 and a P-Value near zero at 2.3e-17, one can define the model as valid.
The probability that correlation between these two variables is caused by randomness is negligible. The R2 of 95% indicates that only approx. 5% of the market value movements are caused by other unidentified factors.
95% of the market value is determined by the S2F ratio.
It is therefore not surprising that Plan B’s model became an instant hit and the preferred model when valuing Bitcoin.
Conclusion: Too good to be true?
According to the above mentioned model, Plan B predicted a market price for BTC after the current halving of 55’000$ (22nd March 2019).
On 27 April 2020, Plan B included silver and gold in his updated version “Stock-to-flow cross-asset model” (S2FX).
The updated version predicts a Bitcoin price far above 100’000$.
Let’s manage expectations and be reasonable here though. A step back and a macro view is always beneficial regardless of any situation, right?
Indeed, the model only takes into account the supply side and completely cuts out the demand aspect. Besides, a well-grounded scepticism on the probability of any asset being able to literally surge within the next few years into a massive market valuation needs to be maintained.
According to the S2F or S2FX model, Bitcoin should multiply approx. by a 10X factor after every halving. As assets gain more market value, the less likely they can perform such outstanding upswings.
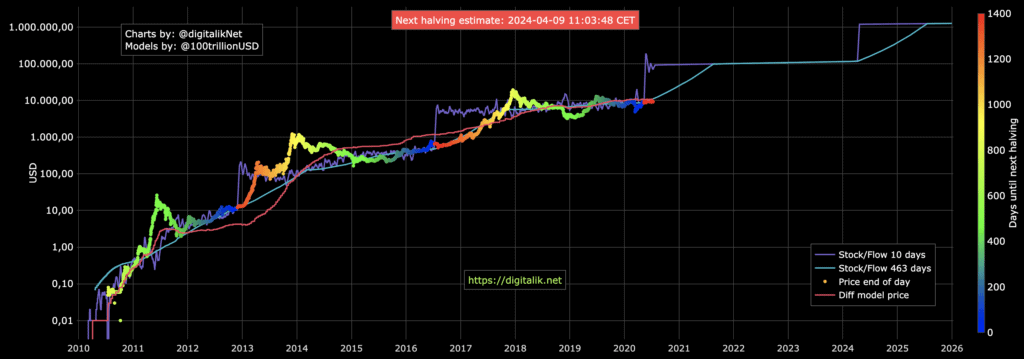
When looking at Figure 3, it seems that BTC is finally starting its upwards correction, gearing to the predicted price above 100’000$.
2021 shall be the year proving that Plan B model was valid or not.
🍿 Get your popcorn ready! 🍿
Sources:
RealVision, Plan B(1), Plan B(2),


 Explained – How does it work?")


